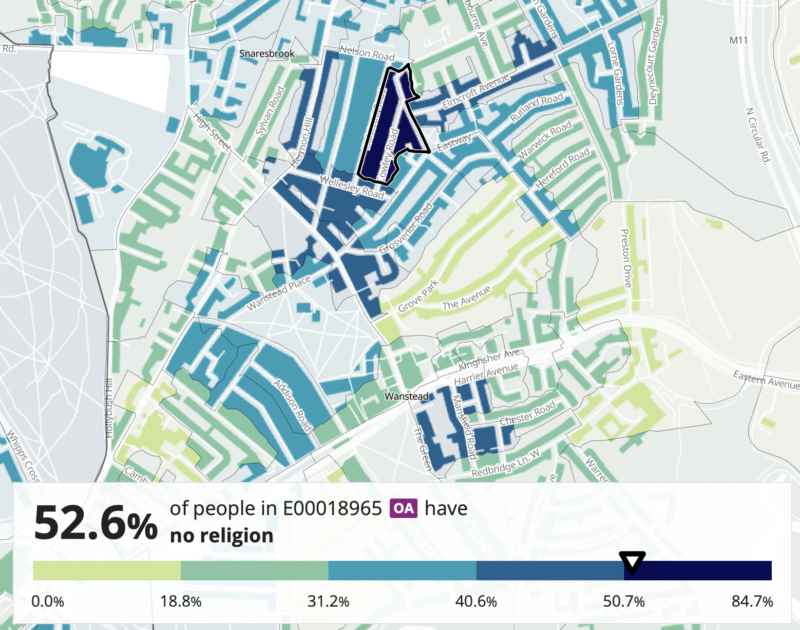
Halstead and Cowley Roads. The 2021 census data published by the ONS which measured people’s descriptions of their own religion is shown on this map, with the dark blue area being the highest response for ‘no religion’.

With even only a quick glance at the data, available here, it’s obvious that it’s hard to draw any meaningful conclusions about why there should be these differences in rates. That doesn’t stop it being interesting though.

I love how the No Religion % is surprisingly high on the pointy bit where Grosvenor Road meets Nightingale Lane…
Nice pattern though! Can we buy print s!?